



Full-Stack Observability on AWS for Reliable Operations
A customer reports that checkout is slow, but CPU utilization is normal. The database team sees no obvious issue. Application logs show scattered timeouts, while the cloud team notices a rise in NAT Gateway traffic. Without connected telemetry, every team is working from a partial view and the incident becomes longer, costlier, and harder to explain.
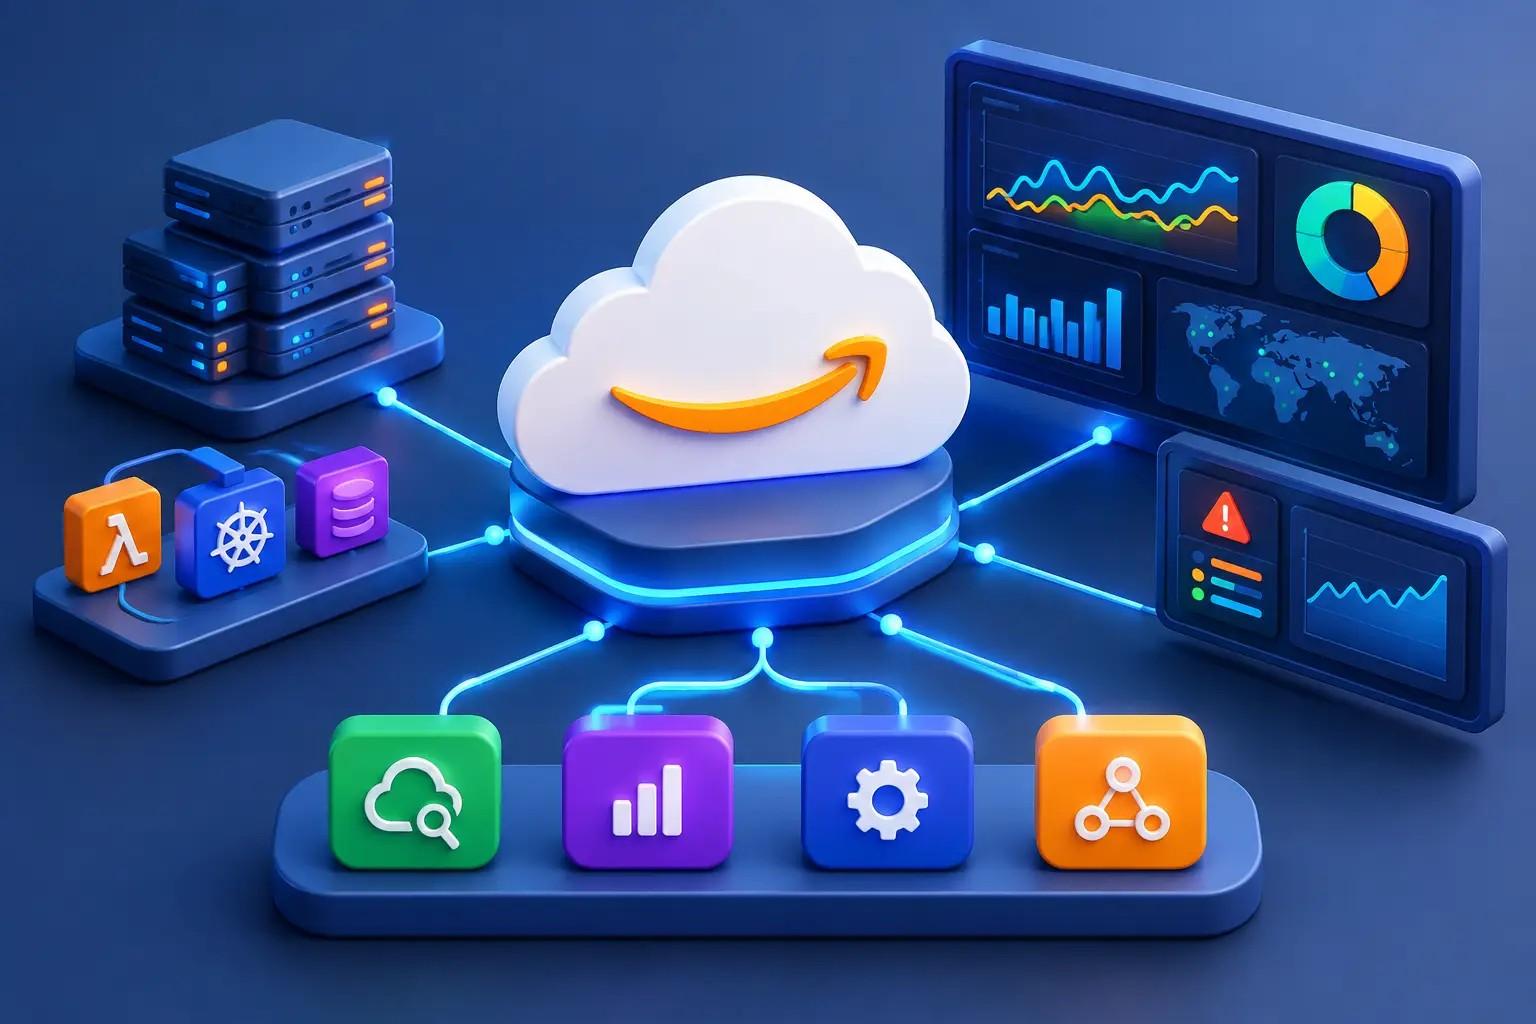
Full-stack observability on AWS gives engineering and operations teams the evidence to move from symptoms to root cause. It brings together infrastructure metrics, application traces, logs, user-facing performance data, deployment events, security signals, and business context so teams can understand how a service behaves across the complete request path.
For organizations running revenue-critical applications, observability is not simply another monitoring dashboard. It is an operational capability that enables faster incident resolution, better customer experiences, more predictable cloud costs, and greater confidence when deploying change.
What Full-Stack Observability Means on AWS
Traditional monitoring answers narrow questions:
- Is the server online?
- Is CPU utilization high?
- Did a backup complete successfully?
- Is disk usage approaching a threshold?
Those checks still matter, but they do not explain why a payment transaction failed or why latency increased after a deployment.
Full-stack observability connects the AWS account, network, compute platform, data layer, application code, and end-user experience. A useful implementation allows an engineer to start with a business symptom, such as failed payments, and follow the evidence across an Application Load Balancer, Amazon EKS service, AWS Lambda function, third-party API, and Amazon RDS query.
The primary telemetry signals are:
Metrics
Metrics reveal patterns and thresholds, including:
- p95 and p99 latency
- Error rates
- Queue depth
- Database connections
- Memory pressure
- Throughput
Logs
Logs provide event-level detail and operational context. Structured logging allows teams to search and correlate activity across multiple services.
Traces
Distributed traces show the complete journey of an individual request, including:
- Every service touched
- Time spent in each dependency
- Error origin
- Bottlenecks and retries
Events
Operational events complete the picture:
- CI/CD deployments
- Terraform changes
- Feature flag updates
- AWS configuration modifications
- Autoscaling actions
- Security events
Observability is not achieved by collecting every possible signal. Success depends on collecting the right signals, applying consistent metadata, and making correlations fast enough to support operational decision-making.
Why Fragmented Telemetry Creates Operational Risk
AWS environments frequently evolve in layers.
A company may use:
- Amazon CloudWatch for infrastructure monitoring
- An Application Performance Monitoring (APM) platform for developers
- Separate security tooling
- Ticketing systems for incidents
- Independent dashboards for networking
Each tool can be valuable, but disconnected ownership and inconsistent naming conventions often create blind spots.
A trace showing a slow API call has limited value if teams cannot correlate it with:
- A Kubernetes pod restart
- A deployment event
- RDS performance changes
- VPC flow anomalies
- Configuration drift
The result is:
- Alert fatigue
- Longer Mean Time To Resolution (MTTR)
- Duplicate investigations
- Increased operational costs
- Excessive escalation to senior engineers
The challenge becomes even greater in multi-account AWS environments where production workloads, shared services, networking, security, and identity controls may all reside in different accounts.
A practical observability strategy must preserve account boundaries and least-privilege security while still enabling authorized teams to investigate cross-account dependencies.
A Real-World Industry Example
AWS has published reference architectures demonstrating how organizations can build centralized observability platforms using:
- AWS Distro for OpenTelemetry (ADOT)
- Amazon Managed Grafana
- Amazon Managed Service for Prometheus
- Amazon OpenSearch Service
The goal is to correlate metrics, logs, and traces across cloud and hybrid environments through a unified observability model. AWS highlights that connected telemetry enables faster root-cause analysis and reduces investigation time during complex incidents.
Why This Matters
Most organizations do not suffer from a lack of monitoring data.
They suffer from a lack of context.
The difference between a four-hour outage investigation and a twenty-minute investigation often comes down to whether teams can connect events across applications, infrastructure, networks, and deployments.
The Role of OpenTelemetry in Modern AWS Observability
OpenTelemetry has become the industry standard for telemetry instrumentation.
AWS actively supports OpenTelemetry through AWS Distro for OpenTelemetry (ADOT), and Amazon CloudWatch now supports OpenTelemetry metrics, logs, and traces. Why OpenTelemetry Matters
Vendor-Neutral Instrumentation
Applications instrumented with OpenTelemetry can send telemetry to different observability platforms without significant code changes.
Reduced Vendor Lock-In
Organizations maintain flexibility if they later decide to adopt a different observability platform.
Consistent Data Model
Metrics, logs, and traces share common attributes, making correlation easier and investigations faster.
Multi-Cloud and Hybrid Readiness
The same instrumentation standards can support AWS, on-premises environments, and other cloud providers.
For many organizations, OpenTelemetry is becoming the foundation upon which observability strategies are built.
Building a Full-Stack Observability Architecture on AWS
Observability should begin with business-critical services, not with tool selection.
Identify the journeys that matter most:
- Customer login
- Checkout
- Payment processing
- Claims processing
- Order fulfillment
- Reporting
- Partner API integrations
Define success criteria for each:
- Availability
- Latency
- Error rate
- Data integrity
- Customer experience
Instrument the Application Layer First
Many observability initiatives succeed or fail at the application layer.
Teams should implement:
- Structured JSON logging
- Correlation IDs
- Distributed tracing
- Standardized metadata
Useful attributes include:
- Service name
- Environment
- AWS region
- Tenant identifier
- Release version
- Request outcome
For Amazon EKS environments, observability should include:
- Pod health
- Restarts
- Node pressure
- Resource requests
- Deployment status
For AWS Lambda workloads, visibility should include:
- Cold starts
- Invocation duration
- Throttling
- Downstream dependencies
- Error behavior
Sampling Strategy Matters
Capturing every trace is not always practical.
A more sustainable approach uses:
- Tail-based sampling
- Error-focused retention
- Selective high-cardinality attributes
- Intelligent filtering policies
Connect Infrastructure and Network Signals
CloudWatch provides foundational visibility across:
- EC2
- EBS
- Elastic Load Balancing
- Lambda
- RDS
- DynamoDB
- API Gateway
- SQS
CloudTrail provides governance visibility, while AWS Config helps identify configuration drift.
Network visibility should include:
- VPC Flow Logs
- NAT Gateway traffic analysis
- Load balancer access logs
- DNS activity
- Transit Gateway telemetry
- Firewall events
Many "application issues" ultimately prove to be connectivity or routing problems.
Without network observability, those root causes can remain hidden for hours.
Security Observability: The Missing Layer
Security and observability increasingly overlap.
Modern operational teams benefit when security telemetry becomes part of incident investigations.
Useful signals include:
- Authentication failures
- Privilege escalation attempts
- Unusual API activity
- Infrastructure changes
- Abnormal data egress
- Configuration drift
Relevant AWS services often include:
- AWS CloudTrail
- AWS Security Hub
- Amazon GuardDuty
- AWS Config
- Amazon Detective
Correlating security events with infrastructure and application telemetry helps identify incidents faster and provides richer forensic context.
Access controls remain essential because logs and traces may contain sensitive information. Organizations should apply:
- Encryption
- Least-privilege access
- Redaction
- Tokenization
- Retention policies
before making telemetry broadly available.
Add Deployment and Configuration Context
Changes should be treated as first-class observability signals.
A latency increase discovered at 14:14 becomes significantly easier to diagnose if teams can see that:
- A deployment occurred at 14:12
- Terraform modified networking rules at 14:10
- An autoscaling event occurred at 14:08
Integrate operational markers from:
- GitHub Actions
- GitLab CI
- Jenkins
- AWS CodePipeline
- Terraform
- Ansible
- Feature flag systems
- Database migration tools
This dramatically shortens the path from detection to remediation.
Managing Observability Costs on AWS
One of the most overlooked aspects of observability is financial sustainability.
Organizations can unintentionally generate substantial costs through:
- Excessive log ingestion
- High-cardinality metrics
- Long retention periods
- Uncontrolled trace collection
- Duplicate telemetry pipelines
Cost-Control Best Practices
Define Retention Policies
Not all logs have equal business value.
Use Trace Sampling
Capture representative workloads instead of every request.
Control Metric Cardinality
Limit exploding label combinations that make metrics expensive.
Apply Storage Lifecycle Policies
Move historical telemetry into lower-cost archival tiers.
Review Utilization Regularly
Unused dashboards, alerts, and retained data should be removed.
Observability should provide insight, not generate its own cost management problem.
AWS Native Services vs Third-Party Platforms
There is no universal answer.
AWS-Native Approach
Common building blocks include:
- Amazon CloudWatch
- AWS X-Ray
- Amazon Managed Grafana
- Amazon Managed Service for Prometheus
- AWS Distro for OpenTelemetry
Advantages:
- Strong AWS integration
- Simple procurement
- Native IAM controls
- Familiar operating model
Third-Party Platforms
Solutions such as:
- New Relic
- Datadog
- Dynatrace
- Other enterprise observability platforms
may provide:
- Broader cross-domain correlation
- Faster root-cause workflows
- Multi-cloud visibility
- Unified user experience
The right choice depends on:
- Application complexity
- Engineering capacity
- Compliance requirements
- Existing skill sets
- Telemetry volume
- Retention requirements
Feature checklists alone rarely produce the correct answer.
Operational Practices That Make Observability Useful
Technology alone will not solve operational challenges.
Every production service should have:
- Clear ownership
- Service-level objectives (SLOs)
- Documented dependencies
- Defined escalation paths
- Runbooks for common incidents
Alerts should reflect customer impact rather than every fluctuation in a metric.
For example:
- Failed backups
- Expiring certificates
- Error budget burn
- Privileged API activity
should not all generate the same severity level.
Effective observability depends as much on operational discipline as on tooling.
Measuring Observability Success
Many organizations implement observability but struggle to prove value.
Track measurable outcomes such as:
Mean Time To Detect (MTTD)
How quickly issues are discovered.
Mean Time To Resolve (MTTR)
How quickly root causes are identified and fixed.
Change Failure Rate
How often deployments introduce incidents.
Deployment Recovery Time
How quickly teams can restore service after a release problem.
Error Budget Consumption
How reliability objectives are performing against targets.
If observability investments are effective, these indicators should improve over time.
A Practical Rollout Strategy
Rather than attempting enterprise-wide standardization immediately:
Step 1: Start Small
Select one or two critical production services.
Step 2: Establish Baselines
Measure:
- Availability
- Latency
- Error rates
- Saturation
- Business transaction health
Step 3: Standardize Telemetry
Create reusable Infrastructure-as-Code modules that apply:
- Tags
- Log retention policies
- Dashboards
- Alerting standards
- IAM controls
Step 4: Test Through Simulations
Run realistic scenarios:
- Database connection exhaustion
- Failed deployment
- Expired certificate
- External API slowdown
- Kubernetes node failure
If engineers cannot quickly identify customer impact, ownership, and remediation steps, the observability design needs refinement.
Frequently Asked Questions
What is the difference between monitoring and observability?
Monitoring tracks known conditions through predefined alerts and dashboards. Observability uses connected telemetry to investigate unknown behavior and discover root causes across systems.
Does every AWS workload need distributed tracing?
No. Distributed tracing provides the greatest value for microservices, serverless architectures, customer-facing APIs, and systems with multiple dependencies. Simpler applications may gain more benefit from metrics, logging, and well-designed alerting.
How can organizations control observability costs?
Use retention policies, trace sampling, cardinality management, lifecycle storage policies, and regular platform reviews. Cost visibility should be treated as part of the observability strategy itself.
Can observability support compliance requirements?
Yes. Audit trails, access logging, encryption, retention management, and change tracking can support regulatory and compliance programs when implemented correctly.
How long does implementation take?
A focused implementation targeting a single production workload can deliver meaningful visibility within weeks. Larger multi-account, hybrid, or regulated environments typically require phased adoption aligned with business priorities.
Conclusion
The most valuable observability test is surprisingly simple:
When a critical service slows down at an inconvenient hour, can the responsible team identify the customer impact, isolate the cause, and respond with confidence?
If the answer is no, the organization does not have an observability problem. It has a decision-making problem.
Full-stack observability enables teams to connect application behavior, infrastructure health, network activity, deployment history, security events, and business impact into a single operational picture.
Done well, it reduces downtime, improves engineering effectiveness, enhances customer experience, strengthens security operations, and creates a more resilient AWS environment.
Build observability until the answer becomes yes.

Written by Yavor Y. Zlatev
CEO & Founder at Advanced Vision IT Ltd | Published on
Yavor advises executive leadership teams on cybersecurity strategy, NIS2 compliance, and cloud operating models to build resilient IT environments.