



Observability vs Traditional Monitoring Explained
A customer reports that checkout is slow, but every server dashboard is green. CPU is normal, memory is stable, and availability checks are passing. This is where observability vs traditional monitoring becomes more than a technical distinction. It determines whether your team can identify the real source of a business-impacting issue before revenue, customer trust, or employee productivity suffers.
Traditional monitoring remains valuable, especially for known infrastructure risks. But cloud-native applications, distributed services, third-party APIs, containers, and frequent deployments create failure modes that static thresholds alone cannot explain. Growing organizations need visibility that helps them move from "something is wrong" to "this dependency, release, query, or configuration change caused the problem."
What traditional monitoring does well
Traditional monitoring is built around checking known conditions. It collects metrics such as CPU utilization, disk capacity, memory consumption, network availability, service uptime, and error counts. Teams then define thresholds and alerts: notify an engineer when disk usage exceeds 85%, a virtual machine is unavailable, or response time crosses an established limit.
This model is proven and necessary. A full disk, expired certificate, unavailable endpoint, or overloaded database should generate an immediate alert. For many smaller environments with a limited number of applications and predictable traffic, traditional monitoring provides an efficient baseline for operational control.
Its strength is clarity. IT teams can quickly see whether key systems are online, whether resources are approaching capacity, and whether expected service-level targets are being met. It also supports routine operational work, including patch verification, backup monitoring, hardware health checks, and basic security event escalation.
The limitation appears when an incident does not fit a predefined condition. A system can be technically available while customers experience delays. A service may pass a health check while a downstream API is failing for a subset of users. An alert may identify elevated latency without showing whether the cause is a recent deployment, a database lock, a network route, or an exhausted connection pool.
Observability vs traditional monitoring: the practical difference
Observability is the ability to understand a system's internal behavior by examining the data it produces. Rather than relying only on a set of known dashboards and alerts, it allows engineers to ask new questions when unexpected behavior occurs.
The standard technical foundation is metrics, logs, and traces. Metrics show trends and operational measurements over time. Logs provide event-level context, such as an application error, authentication failure, or configuration warning. Distributed traces follow a transaction across services, showing how long each component took and where a request failed.
Together, these signals help teams investigate complex behavior in modern environments. If an order-processing request is slow, a trace can show whether the delay occurred in the web application, message queue, payment provider, database, or inventory service. Engineers can correlate that finding with deployment data, infrastructure changes, error logs, and customer impact.
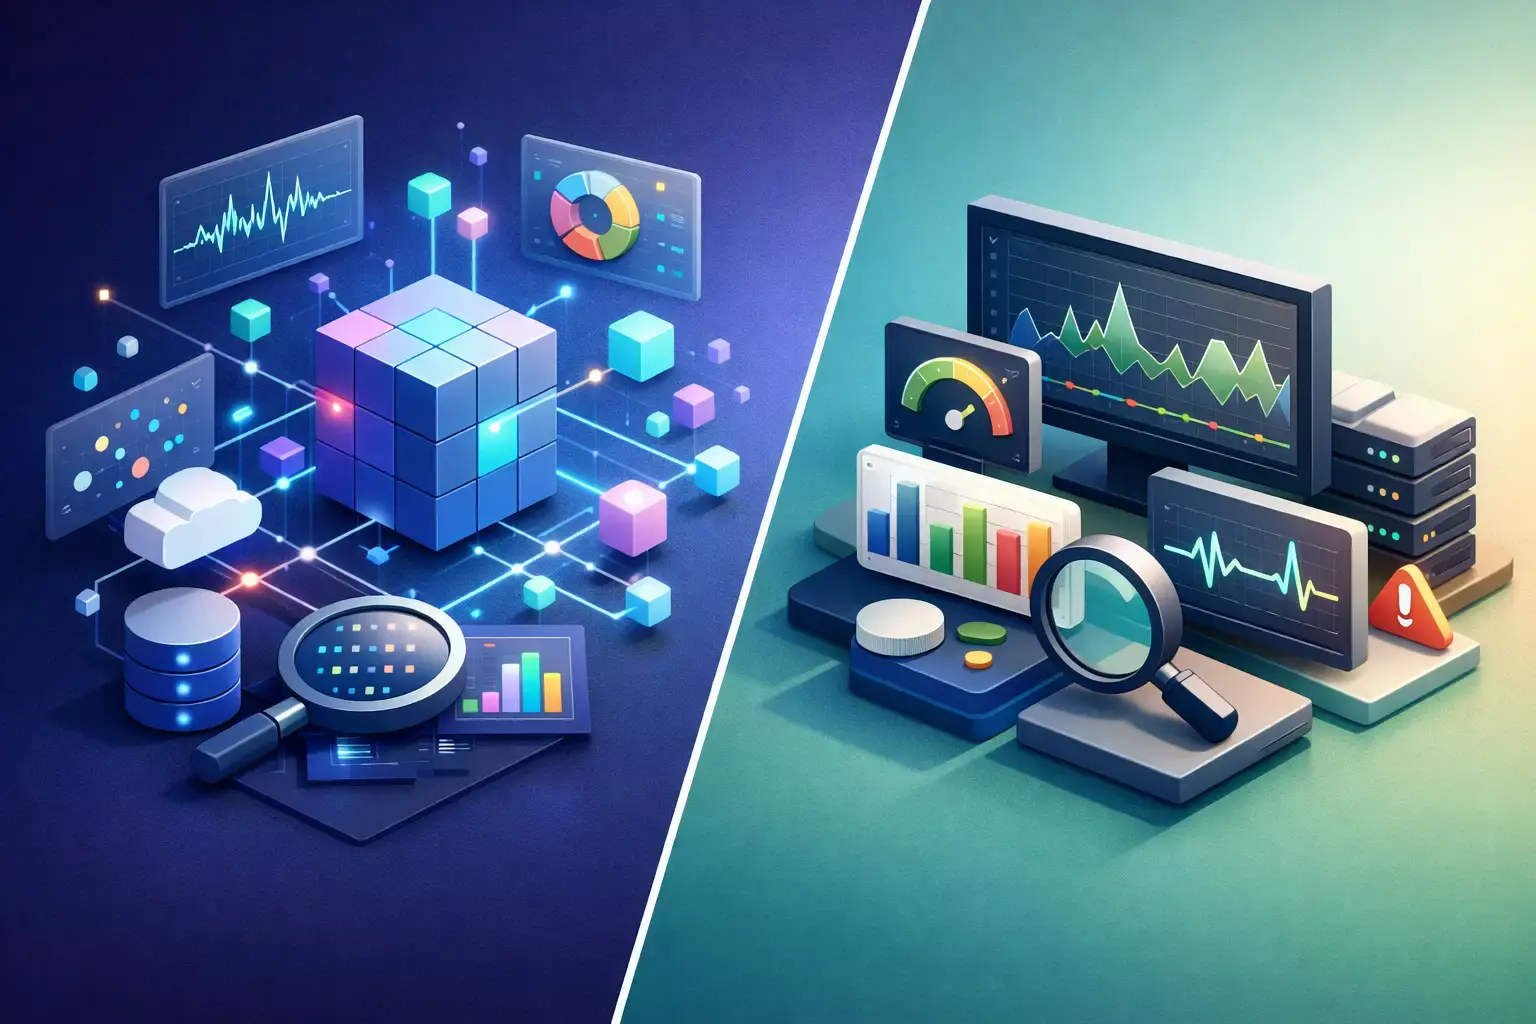
Traditional monitoring asks, "Is the server healthy?" Observability helps answer, "Why are users seeing a problem even though the server is healthy?" Both questions matter. The difference is that observability supports diagnosis across interconnected systems where the root cause is not known in advance.
Why cloud and DevOps environments require deeper context
AWS and other cloud platforms make it possible to scale infrastructure quickly. They also increase the number of moving parts. A typical business application may involve load balancers, containers or virtual machines, managed databases, object storage, identity services, queues, serverless functions, CI/CD pipelines, and external SaaS integrations.
Each component can be operating normally from its own perspective while the full customer transaction fails. A container may be healthy, but a change in an IAM policy can prevent it from retrieving a required resource. A database may have plenty of compute capacity, but an inefficient query introduced in a release can raise response times during peak demand. A third-party service may meet its stated uptime target while still creating intermittent delays that affect your workflow.
This is also why alerts without context can create operational noise. When teams receive dozens of notifications during an incident, they may spend critical time sorting symptoms from causes. Observability platforms such as New Relic can correlate application performance, infrastructure data, logs, browser activity, and synthetic tests so investigators have a more complete operational picture.
The goal is not to collect every possible data point. Excessive telemetry can drive unnecessary cost and make analysis harder. The goal is to collect meaningful, well-labeled data that aligns technical services with business transactions.
The business case is faster decisions, not more dashboards
For leadership teams, the value of observability is measured in risk reduction and operational efficiency. Faster incident resolution reduces downtime, limits customer disruption, and keeps engineering teams focused on delivery rather than prolonged troubleshooting.
It can also improve cloud cost management. When teams understand which services, endpoints, tenants, or workflows consume the most resources, they can make better decisions about scaling policies, database tuning, retention settings, and architecture changes. Cost optimization becomes more precise than simply reducing instance sizes or cutting capacity across the board.
Security and compliance benefit as well. Centralized logs, audit trails, access events, and configuration changes can strengthen investigation and evidence collection. Observability is not a replacement for a security information and event management program, endpoint protection, or access controls. It does, however, provide operational evidence that helps teams detect and investigate unusual behavior across applications and infrastructure.
For a growth-stage company, this visibility supports a practical question: can the current technology stack handle more customers, more transactions, and more releases without increasing operational risk? A well-designed observability practice makes that answer more defensible.
When traditional monitoring is enough
Not every organization needs a large-scale observability implementation on day one. A small internal application with a stable architecture, limited integrations, and low change frequency may benefit more from disciplined baseline monitoring, documented escalation procedures, and tested backups.
The decision changes when systems become distributed, outages are difficult to diagnose, releases are frequent, or the business depends on digital customer experiences. If teams routinely hear that an application is slow before their tools reveal a problem, they need more than uptime checks. If incident reviews end with "we could not reproduce it," richer telemetry and correlation are likely warranted.
The right approach is usually layered. Keep traditional monitoring for availability, capacity, infrastructure health, and known failure conditions. Add observability where application behavior, cross-service dependencies, and user experience create material business risk.
Building an observability practice that produces results
Start with the services and transactions that matter most. For an ecommerce company, that may be product search, checkout, payment authorization, and order confirmation. For a professional services firm, it may be identity access, client portals, document workflows, and line-of-business applications.
Define service objectives around customer outcomes, not just server conditions. For example, measure the percentage of successful checkout transactions, the latency of a critical API, or the time required to complete a scheduled integration. These objectives create a clearer basis for alerting and escalation than infrastructure thresholds alone.
Next, standardize telemetry across the environment. Applications should use consistent log formats and meaningful fields such as request IDs, user or tenant context where appropriate, service names, environment tags, and deployment versions. Infrastructure managed through Terraform or Ansible should be tagged consistently so cloud resources can be connected to the applications and teams they support.
Alert design deserves equal attention. Alerts should be actionable, routed to an accountable team, and tied to an agreed response process. A notification that cannot guide a next step is usually a dashboard observation, not an alert. Review noisy alerts regularly and tune them based on real incident experience.
Finally, connect observability to change management. CI/CD pipelines should record deployment markers, configuration changes, and release versions. During an incident, this enables teams to quickly test whether a behavioral change began after a deployment rather than searching blindly across the stack.
Advanced Vision IT helps organizations apply this model without forcing a one-size-fits-all platform or operating process. The work starts with the environment, business priorities, compliance needs, and the internal team's capacity to act on the data.
The most useful next step is to review your last few incidents. If your team could see the alert but struggled to explain the customer impact or isolate the cause, your monitoring foundation is ready for an observability layer that turns operational signals into faster, more confident action.
FAQ
1. What is the difference between traditional monitoring and observability?
Traditional monitoring focuses on predefined metrics, thresholds, and alerts to detect known issues such as high CPU usage, low disk space, or service outages. Observability goes further by combining metrics, logs, and traces to help teams investigate and understand the root cause of unexpected behavior across complex systems.
2. Why can users experience slow performance when all monitoring dashboards appear healthy?
A system can show normal infrastructure metrics while still delivering a poor user experience. Issues such as database locks, inefficient queries, third-party API delays, configuration changes, or recent deployments may not trigger traditional alerts but can be identified through observability data and distributed tracing.
3. Is observability a replacement for traditional monitoring?
No. Traditional monitoring remains essential for tracking availability, capacity, infrastructure health, and known failure conditions. Observability complements monitoring by providing deeper insights into application behavior, service dependencies, and customer-facing performance issues.
4. When should an organization invest in observability?
Organizations should consider observability when applications become distributed, cloud-native, or highly integrated, and when incidents become difficult to diagnose. Frequent releases, multiple dependencies, and recurring situations where users report problems before monitoring tools detect them are strong indicators that observability is needed.
5. What business benefits does observability provide?
Observability helps reduce downtime, accelerate incident resolution, improve customer experience, support cloud cost optimization, and strengthen security investigations. By quickly identifying the root cause of issues, teams can make faster decisions and reduce operational risk as the business grows.

Written by Miroslav Sultanov
Technical Account Management Team Lead & Senior SEO Specialist at Advanced Vision IT Ltd | Published on
Miroslav advises strategic digital marketing insights, search optimization strategies, and technical team leadership.