



Infrastructure Monitoring Software That Fits Growth
A production outage rarely begins with a single dramatic failure. More often, it starts with a database connection pool nearing its limit, a storage volume filling quietly, an API response time drifting upward, or an AWS cost increase that signals inefficient capacity. Infrastructure monitoring software gives teams the visibility to spot those conditions early, before customers, employees, and revenue feel the impact.
For growth-stage organizations, monitoring is not simply an IT dashboard. It is an operating discipline that connects cloud performance, application reliability, security posture, and spending decisions. The right approach helps a lean technical team make faster decisions without creating a new stream of alerts to manage.
What Infrastructure Monitoring Software Should Actually Do
At its core, infrastructure monitoring software collects telemetry from the systems that run the business. That can include AWS compute instances, containers, Kubernetes clusters, databases, networks, storage, virtual machines, endpoint devices, and critical SaaS dependencies. It turns raw signals into usable information about availability, performance, utilization, and change.
A useful platform goes beyond showing whether a server is up. A server can respond to a basic health check while customers experience slow transactions, failed payments, or timeouts. Monitoring should expose the relationship between infrastructure behavior and service outcomes: rising CPU during a deployment, database latency affecting checkout requests, or packet loss degrading remote access.
This distinction matters because isolated metrics create false confidence. Teams need context across layers. When an application slows down, the issue may be code, a dependency, DNS, database locks, container limits, network routing, or undersized cloud resources. Good observability reduces the time spent guessing where to look first.
Start With Business-Critical Services, Not Every Metric
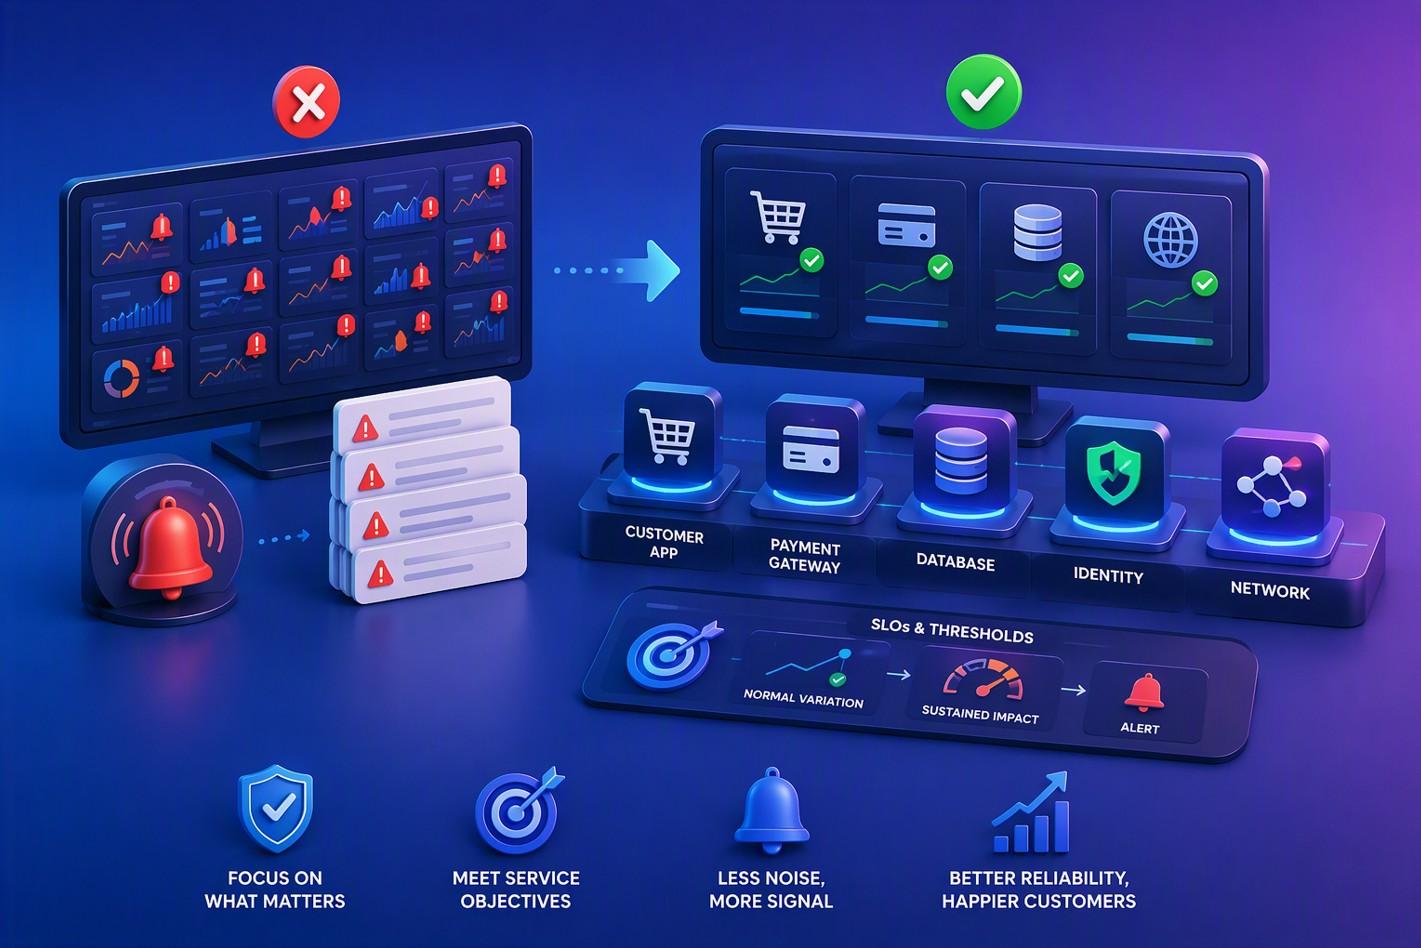
Many companies make the same early mistake: they connect a monitoring tool to everything, accept the default alerts, and wait. Within weeks, the team is receiving notifications about transient CPU spikes, scheduled backups, and short-lived container events that require no action. Alert fatigue follows, and meaningful warnings get missed.
A better implementation starts with the services that carry real operational risk. Identify the customer-facing applications, internal platforms, integration points, identity systems, databases, and network paths that would materially disrupt the business if they failed. For each, define what healthy performance means.
For an e-commerce platform, that could include successful checkout transactions, payment gateway response time, database capacity, error rates, and availability across application tiers. For a professional services firm, the priority may be identity provider availability, secure remote connectivity, file access, backup completion, and endpoint health. The technology may be different, but the decision framework is the same: monitor what the business cannot afford to lose.
Service-level objectives provide a practical anchor. Rather than alerting whenever CPU exceeds 70 percent, set thresholds around conditions that threaten a service objective. A short CPU burst might be normal. Sustained resource contention paired with rising request latency is a different event and deserves attention.
The Signals That Matter Most
A mature monitoring program uses several forms of telemetry together. Metrics show trends and resource behavior. Logs provide event-level evidence. Traces follow transactions across distributed services. Synthetic checks test key user paths from outside the environment. Each fills a different gap.
Metrics are often the first layer because they are efficient for tracking availability, latency, error rates, saturation, storage consumption, and network throughput. They answer questions such as whether database read latency is rising or whether a workload is approaching its memory limit.
Logs become essential when a metric indicates trouble but does not explain why. Structured application logs can reveal failed authentication attempts, dependency errors, unexpected exceptions, or configuration changes. Centralizing them also makes incident investigation less dependent on logging into individual servers or containers.
Distributed tracing is particularly valuable for cloud-native and microservices-based systems. A single user request may cross an API gateway, several services, a message queue, and a database. Traces show where time was spent and where a failure originated. For teams modernizing toward containers or serverless services, this level of visibility can shorten diagnosis significantly.
Synthetic monitoring adds an outside-in perspective. It can test whether a login, checkout flow, API endpoint, or customer portal is reachable and functioning. Internal infrastructure metrics may look normal while users in a specific geography or network path experience an issue. Synthetic checks help expose that difference.
Choosing Infrastructure Monitoring Software for Your Environment
There is no universal best platform. The right choice depends on the architecture, team capabilities, compliance obligations, and how much operational tooling the business can realistically maintain.
Cloud-native teams running primarily on AWS may benefit from services that integrate closely with CloudWatch, CloudTrail, IAM, and native AWS health events. That integration can simplify initial deployment and support governance requirements. The trade-off is that a heavily native approach can become harder to use if the company operates hybrid infrastructure, multiple clouds, or on-premises systems.
Platforms such as New Relic can provide broad visibility across infrastructure, applications, logs, and user experience in a consolidated interface. They can be a strong fit when teams need correlated data and faster investigation across complex systems. Licensing models, data volume, retention needs, and agent coverage should be assessed carefully before standardizing.
Open-source tooling can offer flexibility and control. Prometheus, Grafana, OpenTelemetry, and related components are widely used for Kubernetes and cloud-native environments. However, software licensing is only one part of the cost. Teams must account for design, hosting, upgrades, storage, security, data retention, and on-call ownership. A platform that is inexpensive to adopt can become expensive to operate without internal expertise.
For hybrid organizations, look for broad agent support, API integrations, network monitoring capabilities, and a practical way to correlate cloud resources with servers, endpoints, and business applications. Vendor-neutral design matters when the environment will change over time. Monitoring should support modernization, not force architecture decisions around a single tool.
Alert Design Is an Operations Decision
The value of monitoring is realized in the response, not in the dashboard. Every alert should have an owner, a severity level, a notification path, and a documented first action. If a notification does not lead to a decision or a defined action, it is probably noise.
Start with alerts for confirmed service unavailability, sustained performance degradation, failed backups, certificate expiration, critical security events, resource exhaustion, and failed deployment or automation jobs. Use warning-level notifications more selectively for trends that need planned attention, such as capacity growth or rising cloud spend.
Alert thresholds should reflect normal behavior. A batch-processing server may legitimately run at high utilization overnight. A customer API that suddenly reaches the same utilization level at noon may be signaling an incident. Baselines and anomaly detection can help, but they should be validated against real workload patterns rather than accepted automatically.
Escalation also needs to match the business. A noncritical reporting service may create a ticket for next-business-day review. A failed identity provider, exposed production security event, or customer-facing outage may require immediate paging and an incident process. Treating every alert as urgent teaches teams to ignore urgency.
Monitoring, Security, and Compliance Belong Together
Infrastructure monitoring is not a replacement for security tooling, but the two disciplines reinforce each other. Unexpected privilege changes, disabled logging, unusual outbound traffic, repeated authentication failures, or configuration drift can all appear first as operational signals. Centralized visibility makes these events easier to investigate and correlate.
For organizations with compliance requirements, monitoring also supports evidence collection. Teams may need to demonstrate that backups completed, access controls were reviewed, critical systems were available, changes were recorded, and security events were retained. The exact requirements depend on the regulatory framework, but the operational benefit remains consistent: less manual evidence gathering and clearer accountability.
This is where infrastructure-as-code practices add value. Terraform and Ansible can standardize monitoring agents, alert policies, tagging, log forwarding, and dashboard configurations across environments. Instead of relying on a series of manual setup steps, teams can version and review the monitoring configuration alongside the infrastructure it observes.
Turn Monitoring Data Into Better Capacity and Cost Decisions
Cloud elasticity does not eliminate capacity management. It changes the questions. Teams need to know whether autoscaling policies are responding correctly, whether rightsizing is safe, whether idle resources are accumulating, and whether a sudden spend increase aligns with business demand or a configuration issue.
Monitoring data can reveal underused instances, overprovisioned database tiers, unattached storage, inefficient container requests, and recurring traffic patterns. Used carefully, it supports cost optimization without cutting capacity blindly. The lowest infrastructure bill is not the objective if it increases failure risk or slows critical applications.
A monthly operational review is often more valuable than another dashboard. Review availability, recurring incidents, noisy alerts, capacity trends, deployment impact, security observations, and cloud cost changes together. This creates a feedback loop between engineering work and business priorities.
Advanced Vision IT helps organizations build that loop through managed observability, AWS expertise, DevOps automation, and hands-on operational support. The goal is not to collect more telemetry. It is to make infrastructure behavior understandable and actionable for the people responsible for keeping the business running.
The most effective monitoring environment is one your team trusts during a difficult hour. Build it around critical services, tune it to real operating patterns, and give every meaningful signal a clear path to action. That is how visibility becomes resilience.
User Story: When Monitoring Prevented a Costly Outage
Consider a fast-growing e-commerce company preparing for its annual seasonal sales campaign. Traffic volumes were increasing daily, and everything appeared healthy from a basic infrastructure perspective. Servers were running, applications were online, and standard health checks were passing.
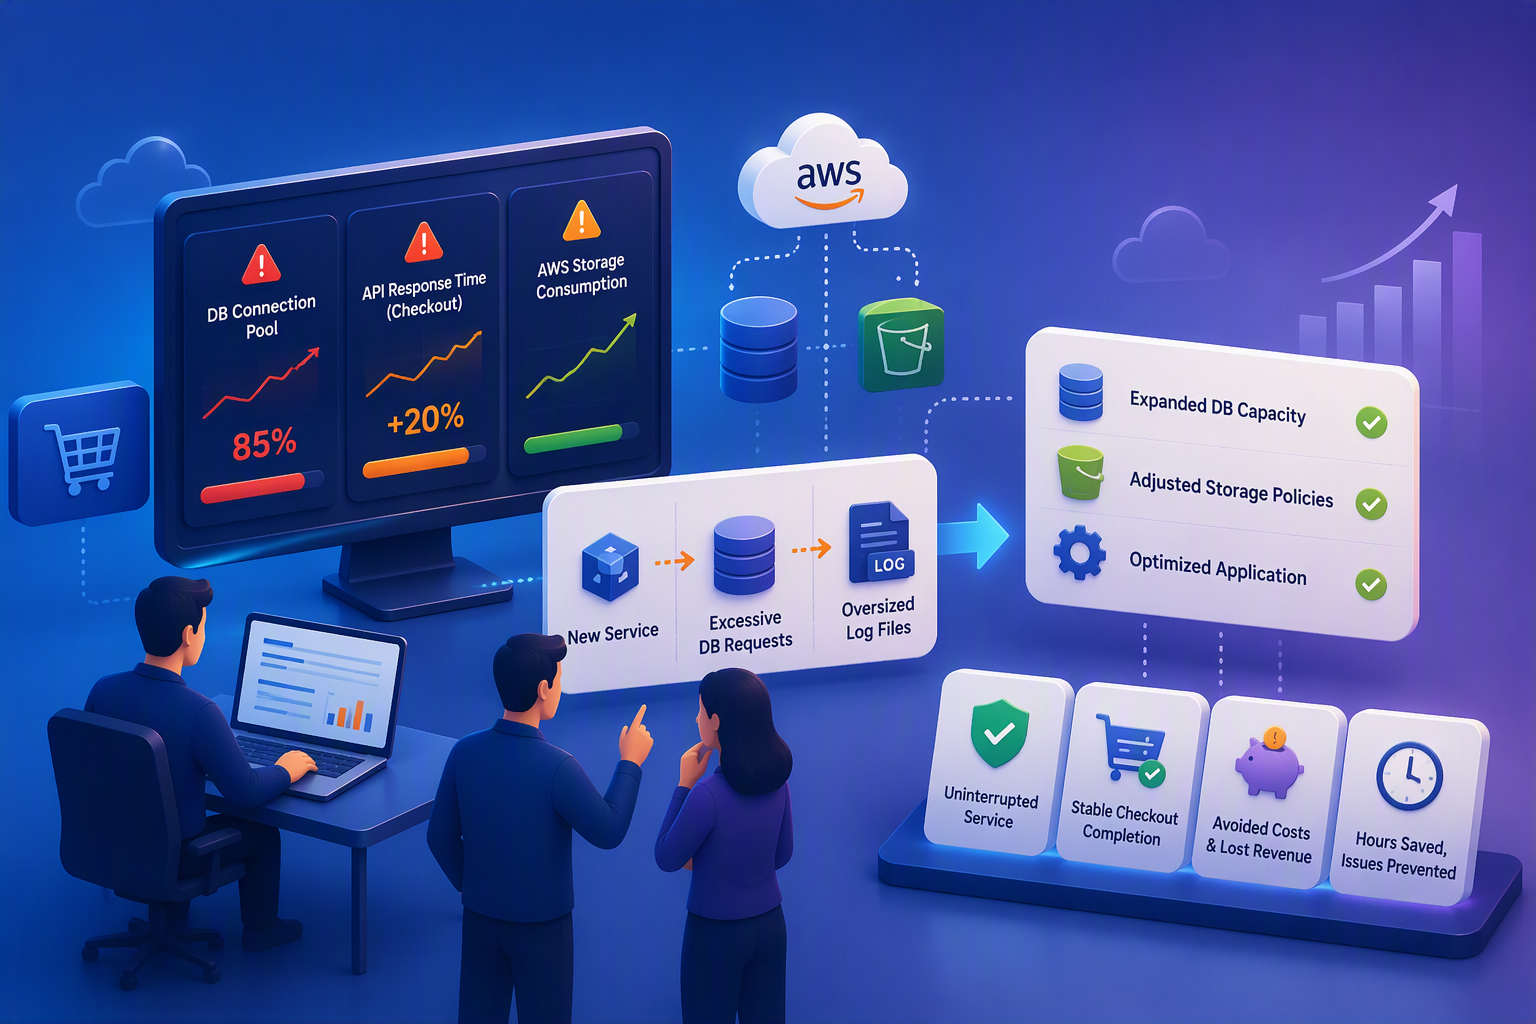
However, the organization's infrastructure monitoring software identified three subtle warning signs:
- Database connection pool utilization had reached 85% and was steadily increasing.
- API response times for checkout transactions had risen by 20% over the previous week.
- AWS storage consumption was growing faster than anticipated due to an application logging issue.
Because the monitoring platform correlated infrastructure metrics with application performance data, the operations team recognized that these isolated signals were connected. They traced the issue to a newly deployed service generating excessive database requests and oversized log files.
Rather than discovering the problem during peak customer traffic, the team corrected the application behavior, expanded database capacity, and adjusted storage policies before the sales event began.
As a result:
- Customers experienced uninterrupted service during the campaign.
- Checkout completion rates remained stable.
- The company avoided emergency scaling costs and lost revenue.
- The technical team spent hours resolving a planned maintenance issue instead of days responding to a production incident.
This illustrates the true purpose of infrastructure monitoring: not simply detecting failures, but identifying risks early enough to prevent business disruption.
Why This Matters
Infrastructure monitoring is often viewed as a technical requirement, but its business impact is much broader.
Prevent Revenue Loss
Performance degradation frequently affects customers before complete outages occur. Monitoring helps teams identify bottlenecks before slow transactions, failed payments, or service interruptions impact revenue.
Reduce Mean Time to Resolution (MTTR)
When incidents occur, visibility across metrics, logs, traces, and dependencies helps teams quickly determine the root cause instead of spending valuable time troubleshooting blindly.
Improve Customer Experience
Users rarely care whether a server is running. They care whether applications are fast, reliable, and available. Monitoring aligns operational metrics with customer outcomes.
Support Security and Compliance
Unexpected configuration changes, unusual traffic patterns, failed logins, and audit evidence requirements often surface through monitoring data. Strong visibility improves both security investigations and compliance readiness.
Optimize Cloud Spending
Monitoring identifies underutilized resources, inefficient workloads, storage growth trends, and scaling opportunities, helping organizations control cloud costs without sacrificing performance.
Enable Smarter Growth
As environments become more complex, monitoring provides the operational data needed to make informed decisions about modernization, scaling, automation, and infrastructure investments.
Ultimately, infrastructure monitoring transforms IT operations from reactive firefighting into proactive business enablement.
FAQ
1. What is infrastructure monitoring software?
Infrastructure monitoring software collects and analyzes telemetry from servers, cloud resources, networks, databases, containers, endpoints, and applications. It provides visibility into performance, availability, capacity, and operational health to help teams identify issues before they cause business disruption.
2. How is infrastructure monitoring different from observability?
Traditional monitoring focuses on predefined metrics and alerts that indicate whether systems are functioning as expected. Observability expands on this by combining metrics, logs, traces, and contextual data to help teams understand why a problem occurred and how it affects the broader environment.
3. What should be monitored first?
Organizations should start with services that are most critical to business operations. These typically include customer-facing applications, identity systems, databases, payment platforms, backup systems, network connectivity, and critical cloud infrastructure.
4. How can companies avoid alert fatigue?
Alert fatigue occurs when teams receive excessive notifications that do not require action. The best approach is to focus alerts on conditions that threaten service objectives, assign clear ownership, define escalation paths, and continuously review alert effectiveness.
5. What business benefits does infrastructure monitoring provide?
Effective monitoring helps organizations reduce downtime, improve customer experience, strengthen security, support compliance efforts, optimize cloud spending, accelerate troubleshooting, and make more informed operational decisions as they scale.
Key Takeaway: The best infrastructure monitoring environments do not simply generate alerts. They provide actionable insights that connect technology performance to business outcomes, enabling teams to detect problems early, respond confidently, and maintain resilient operations as the organization grows.

Written by Yavor Y. Zlatev
CEO & Founder at Advanced Vision IT Ltd | Published on
Yavor advises executive leadership teams on cybersecurity strategy, NIS2 compliance, and cloud operating models to build resilient IT environments.